Stage 1
Origination & feasibility
Hostile counties pass initial screening. Deposits sink into sites that will never clear zoning.
The False Positive
Wasted opexSinking the Deposit
Trapped capital
LANDMARQ maps the build-out, measures local impact, monitors political and community signals, and prices the resulting friction before capital is committed.
01The Problem
“We spend 6 months and $300K engineering a perfect site, only to have 50 angry neighbors kill it at the first town hall. We have no data to predict this.”
No incumbent has addressed this. It is the only unpriced variable in the stack, and it is where LANDMARQ operates.
02Value Destruction Cascade
Catching it at origination costs nothing. By the time it surfaces in permitting, developers have typically sunk $200K+ in legal and engineering spend.
By construction, you are looking at injunctions, multi-year delays, and financing that has walked out the door.
Stage 1
Hostile counties pass initial screening. Deposits sink into sites that will never clear zoning.
The False Positive
Wasted opexSinking the Deposit
Trapped capitalStage 2
Zoning boards deny after spend is deployed. Counterparties withdraw when headline risk appears.
The Town Hall Kill
$200K+ sunkCapital Flight
Deal collapseStage 3
Lawsuits stop work after permit issuance. Litigation and friction drag on for years.
The Injunction
12–36 monthsOperational Drag
IRR erosion03See It In Action
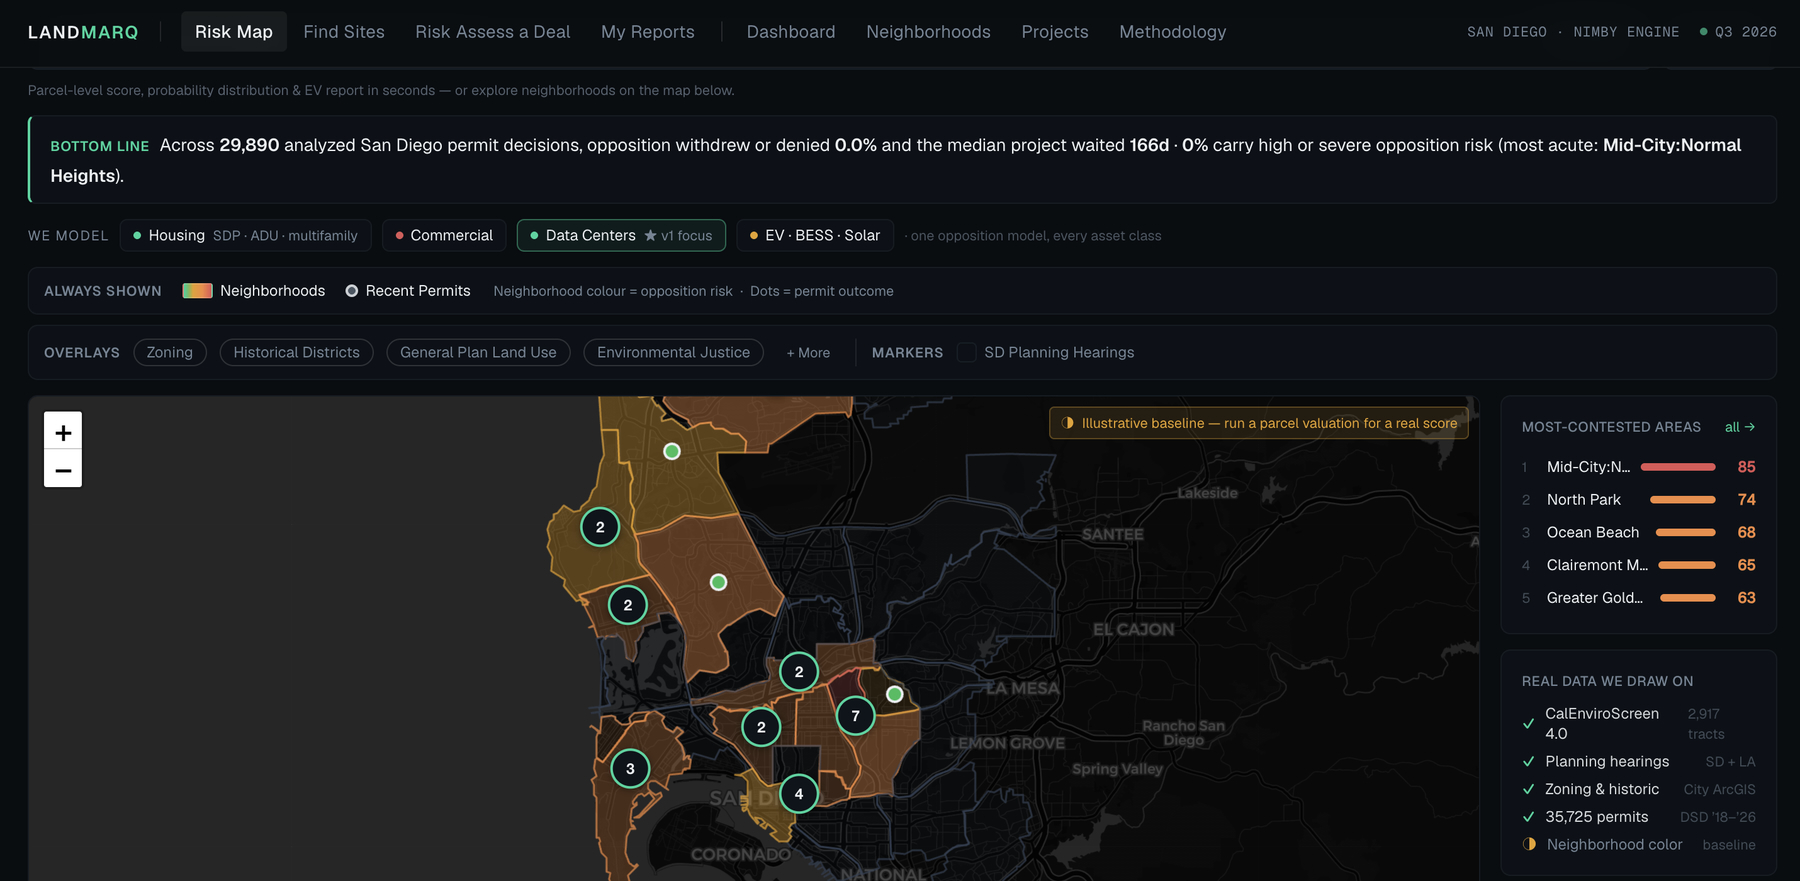
The same signal driving today’s data center backlash, scored for every asset class before you commit capital.
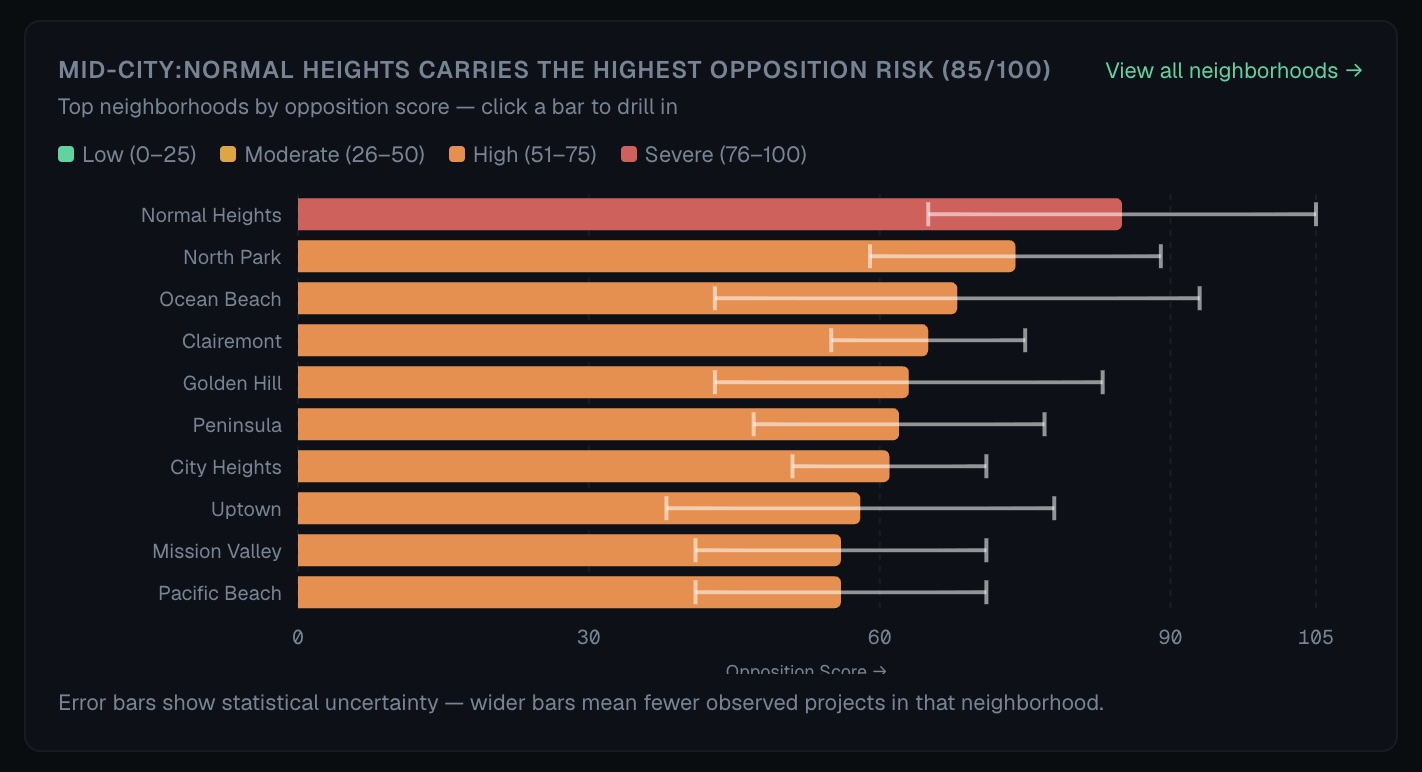
Exhibit A
The same submarket-level signal now stalling data center approvals nationwide, scored with confidence intervals for every neighborhood.
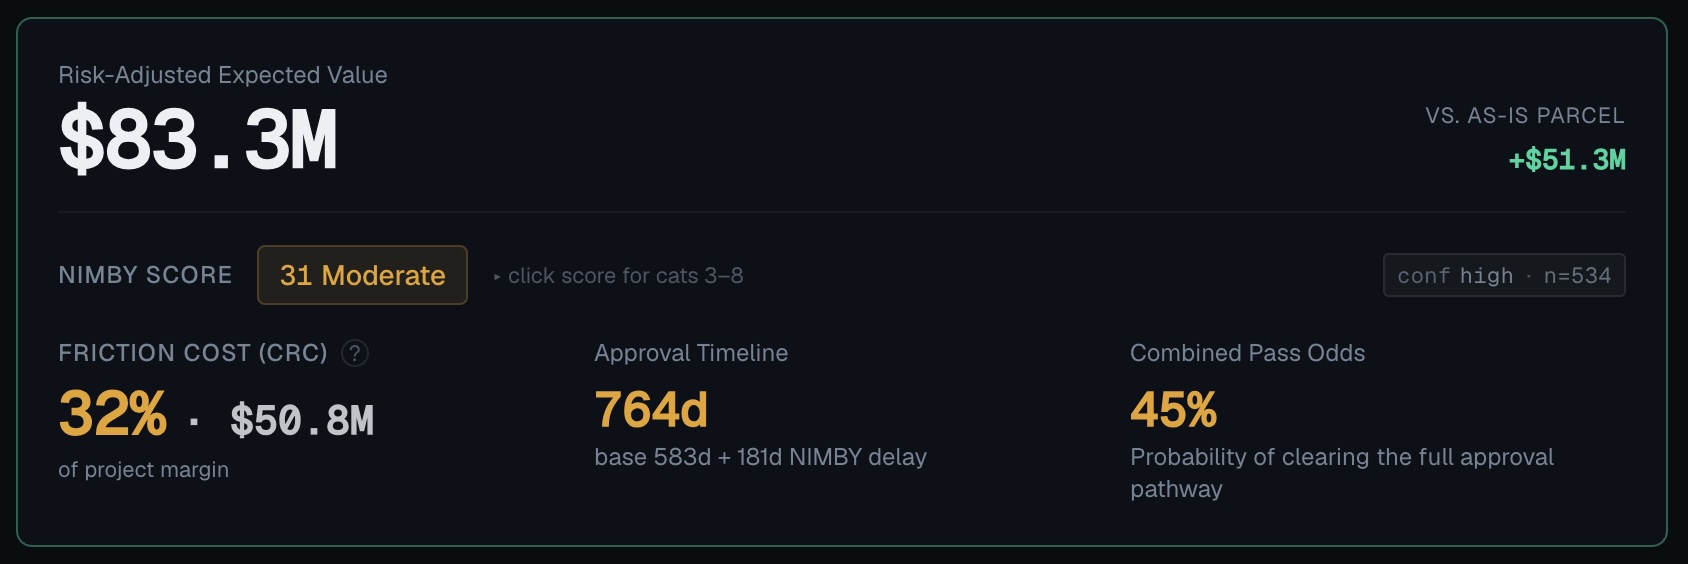
Exhibit B
Expected value modeled against friction cost, approval timeline, and combined pass odds.
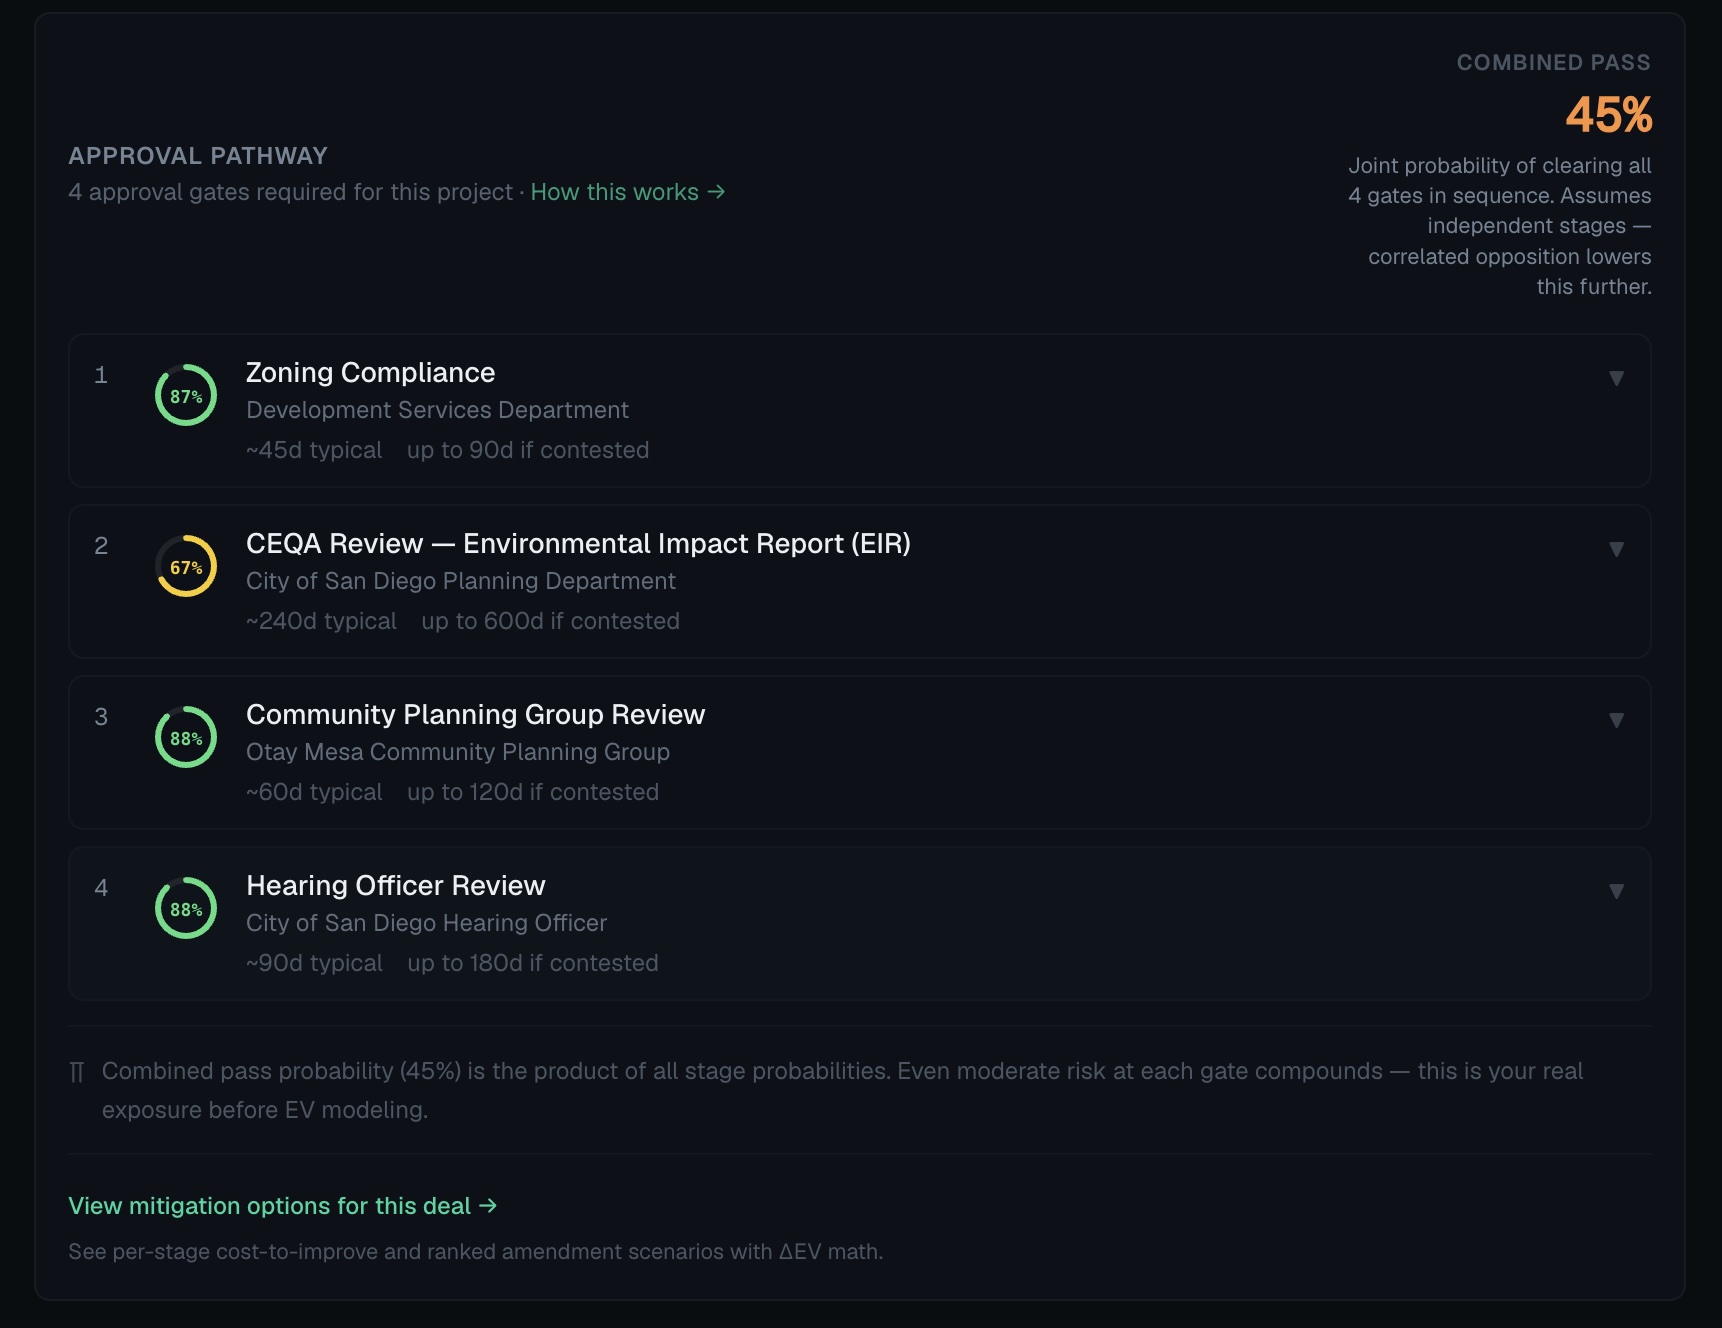
Exhibit C
Four approval gates, each with its own pass odds and timeline. This is the sequence that turns a 90-day filing into a 764-day fight.
04Competitive Landscape
The gap persists because acquiring outcome data is genuinely hard.
Opposition signals are unstructured, localized, and buried in municipal PDFs. Building the pipeline to extract and score that data is what creates a defensible position.
| Capability | LANDMARQ | Gridics / Zoneomics | HouseCanary | Cape Analytics |
|---|---|---|---|---|
| Political and community risk | No | No | No | |
| Approval score | No | No | No | |
| Opposition model verified | No | No | No | |
| Geographic footprint | San Diego (pilot)National rollout planned | National | National | National |