01 · Map
Helios
The global infrastructure atlas: where assets, operators, and capacity concentrate. Creates the top of the funnel for global discovery.
Key Numbers
1 in 4
Projects killed by opposition
Solar, wind, BESS, data centers
$200K+
Sunk cost per dead site
Before opposition surfaces
~$12K
LANDMARQ diligence cost
Full desktop score · Day 1
<200ms
Processing time
Full 7-variable score per parcel
Platform Architecture
Discovery feeds distribution, distribution feeds monitoring, and all three feed the decision customers pay for.
01 · Map
The global infrastructure atlas: where assets, operators, and capacity concentrate. Creates the top of the funnel for global discovery.
02 · Understand
Local impact: what current and proposed facilities mean for a specific place. The same records as a public, place-based experience.
03 · Monitor
Live intelligence on projects, policy, dockets, officials, and organized groups, with alerts and watchlists that signal when a project needs rescoring.
04 · Decide
Project underwriting: regulatory path, timeline, friction cost, and capital action. Where the customer pays, and where the Tier 1–4 recommendation below is generated.
The Platform Pillars
Pillar 01
Evaluates whether a parcel's highest and best use aligns with the proposed infrastructure type, factoring in agricultural comparable values, land use history, and surrounding development patterns. Surfaces misaligned sites before engineering capital is committed.
Pillar 02
Surfaces available grid headroom from HIFLD databases and interconnection queue position data, filtering sites where grid constraints would kill the project independent of community factors. Prevents capital from entering a saturated queue for a site with no viable path to interconnection.
Pillar 03 · Core Engine
The core scoring engine. Translates 100+ observable signals across seven variable categories into a single Community Risk Score and opposition probability, with a Tier 1–4 IC recommendation generated in under 200ms.
Pillar 04
Analyzes surrounding land value trends and comparable transactions to assess whether a site sits in a corridor with upward or downward development pressure. A signal for both community opposition risk and long-term project IRR.
See It In Action
Development Risk Report
Select a neighborhood and get a full risk breakdown: historical approval rate, opposition risk score, and the odds of clean approval, conditional approval, or rejection before a dollar of diligence is spent.

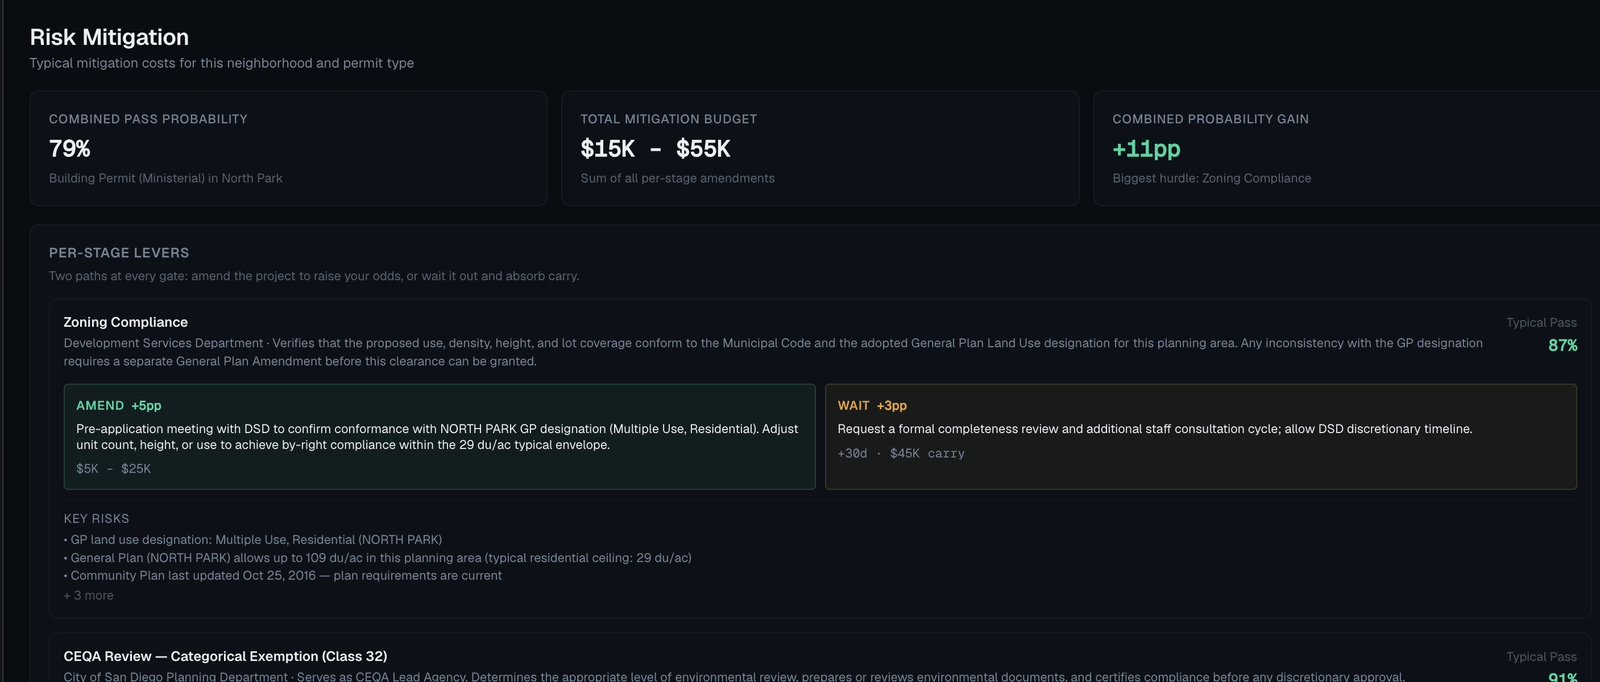
Risk Mitigation
Every approval gate comes with two priced paths forward: amend the project for a faster, cheaper probability boost, or wait it out and absorb the carrying cost. Both options are quantified in probability points and dollars.
NIMBY Score Engine
A read on local political and community sentiment that standard zoning data doesn't capture, drawn from public sources most diligence teams never think to check.
Strongest predictor per Stokes et al. (2023, PNAS)
A jurisdiction's track record with comparable projects. Places that have said no before tend to say no again, and that pattern is measurable.
Susskind et al. (2022, Energy Policy)
The permitting pathway itself: which approvals are required, what triggers a public hearing, and where a moratorium or environmental review could add friction.
Wolsink (2000, Renewable Energy)
How a project shares value with the community it sits in, and how early developers engage with it. Both move opposition more than most teams expect.
Löw-Beer et al. (2025, Nature Communications)
What the site actually looks and feels like from the surrounding neighborhood. Two parcels with identical zoning can face very different opposition depending on what's visible from the road.
Roddis et al. (2018, Applied Energy)
Whether the surrounding region has already absorbed its share of similar projects. Saturation drives resistance regardless of an individual project's merits.
US EPA Cumulative Impacts Framework (2022)
Demographic and socioeconomic context, used as a secondary signal alongside sentiment and permitting history, never as a standalone predictor.
Stokes et al. (2023, PNAS)
Tier Recommendations
Opposition <15%
Value at Risk <5%
Low community friction. Suitable for engineering diligence. No material opposition risk identified.
Opposition 15–35%
Value at Risk 5–15%
Elevated friction. A community engagement strategy is recommended before advancing to interconnection deposit.
Opposition 35–60%
Value at Risk 15–30%
High friction. IC review required. Consider alternative sites in the same geography before committing capital.
Opposition >60%
Value at Risk >30%
High opposition risk. Estimated exposure warrants site abandonment unless material mitigants exist.
Opposition probability is a probabilistic opinion analogous to a credit rating, not a legal opinion or permitting guarantee. See full methodology disclaimer.
Research Foundation
What makes this model defensible is the weighting logic and the labeled outcome dataset behind it, both built in-house.
Stokes et al. (2023, PNAS)
Community sentiment and political climate are the primary predictors of opposition in North American renewable energy siting datasets.
Susskind et al. (2022, Energy Policy)
Procedural history and prior permitting outcomes are stronger opposition predictors than ideology or demographic composition.
Löw-Beer et al. (2025, Nature Communications)
Explicit benefit-sharing and early community engagement significantly reduce organised opposition rates across multiple datasets.
Access & Pricing
Founder-led paid pilots opening Q3 2026 · Per-site pricing to follow